
Billboards, print placements, and OOH displays finally get the same tracking your digital campaigns have always had. Every physical ad gets a digital heartbeat.
Billboards and transit ads generate impressions you can estimate but never actually measure. You pay for eyeballs you can only guess at.
When the CFO asks what the print buy actually drove, the honest answer is "we don't know." Attribution is guesswork at best.
Digital campaigns get optimized hourly. Physical campaigns run blind from launch to teardown. No pivots. No data.
NFC smart tags turn static placements into tracked, measurable, optimizable touchpoints. Same rigor you expect from paid digital, applied to the physical world.
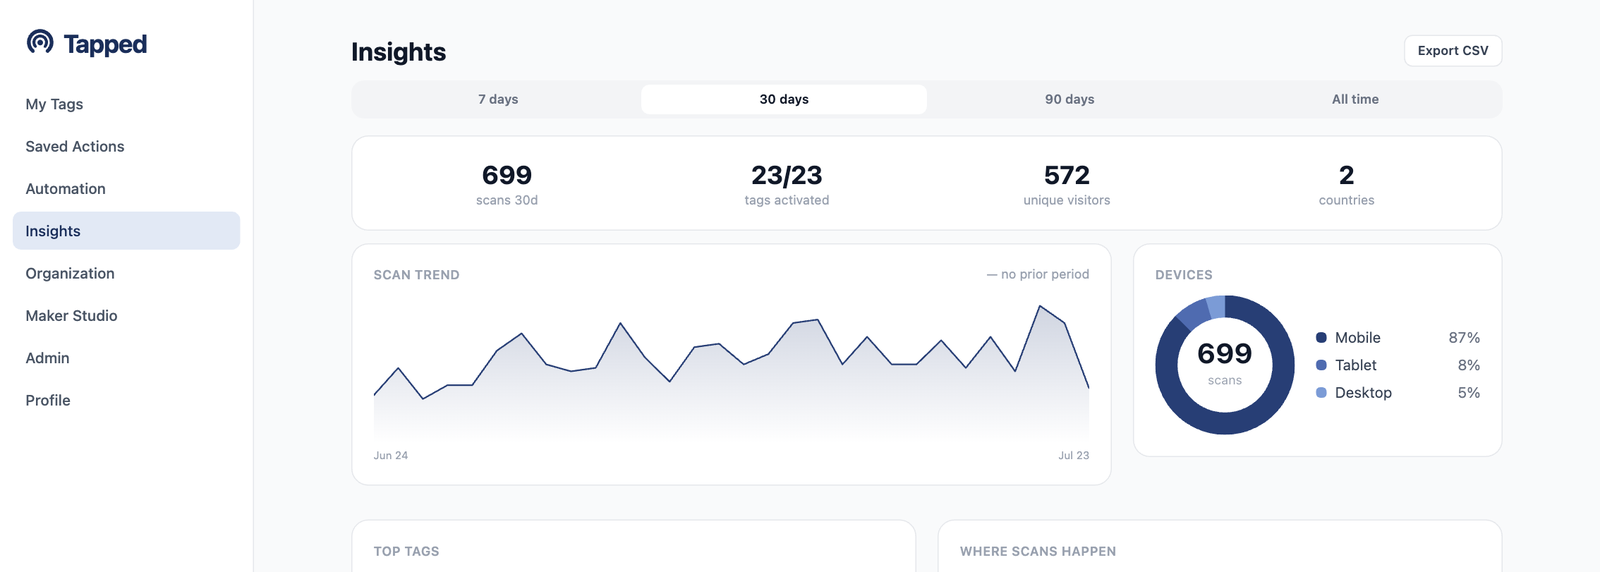
Insights show scan trends, unique visitors, and device breakdowns for every tag.
Every NFC tag carries your campaign, source, and medium parameters automatically. When someone taps a billboard tag, the UTM data flows straight into GA4, your ad platform, or your CDP. No manual URL typing. No broken links.
Watch your OOH campaign come alive. Scan volume spikes, device breakdowns, geographic heat maps, and time-of-day patterns tell you exactly how your physical placements are performing, as they perform.
Test different landing pages from the same physical placement. Swap the destination mid-flight and compare scan trends in Insights. The same tag on the same billboard can serve different experiences and tell you which one wins.
NFC tags go onto billboard frames, bus shelter panels, and transit displays. Each tag carries unique UTM parameters tied to placement, market, and creative variant.
Real-time dashboard lights up. You see which markets, which placements, and which times of day are driving engagement. Device data and geo heat maps populate automatically.
Landing page B is clearly outperforming A. You pivot all tags to the winning variant from your dashboard. No reprints. No site visits. Live in seconds.
Present the board with scans per placement, cost per measurable engagement, conversion paths, and geographic performance. No guesswork. No estimates. Data.
Every tap on a billboard, shelter panel, or print placement is a measured touch — time, place, device — carried into GA4 or your CDP on clean UTM parameters. When you can see which placements produce engagement, the next buy goes where the data points instead of where the sales rep does.
Swapping a destination or creative experience is a dashboard change, not a reprint, a site visit, or a change order. A placement that would otherwise run its full flight underperforming gets re-aimed at the winning landing page the day you spot the trend.
The tag on the frame stays when the creative changes — the next flight starts with tracked touchpoints already in place. And every campaign's scan data adds to what you know about markets, placements, and dayparts, so each media plan starts smarter than the last.
The tags are bought once. The destinations, the tests, and the attribution keep running flight after flight.
Of scans tracked — device, location, time
API endpoints for custom reporting pipelines
Automation engines — rotate, schedule, and route
Campaign swaps — change destinations without replacing tags
Start measuring OOH the way you measure digital. Five free tags, full analytics, no credit card.
Start free with 5 tagsNo credit card required. Upgrade any time.