Every scan becomes a data point in Insights: trends, unique visitors, devices, geography, and the hours that matter. No setup — it's on from the first scan.
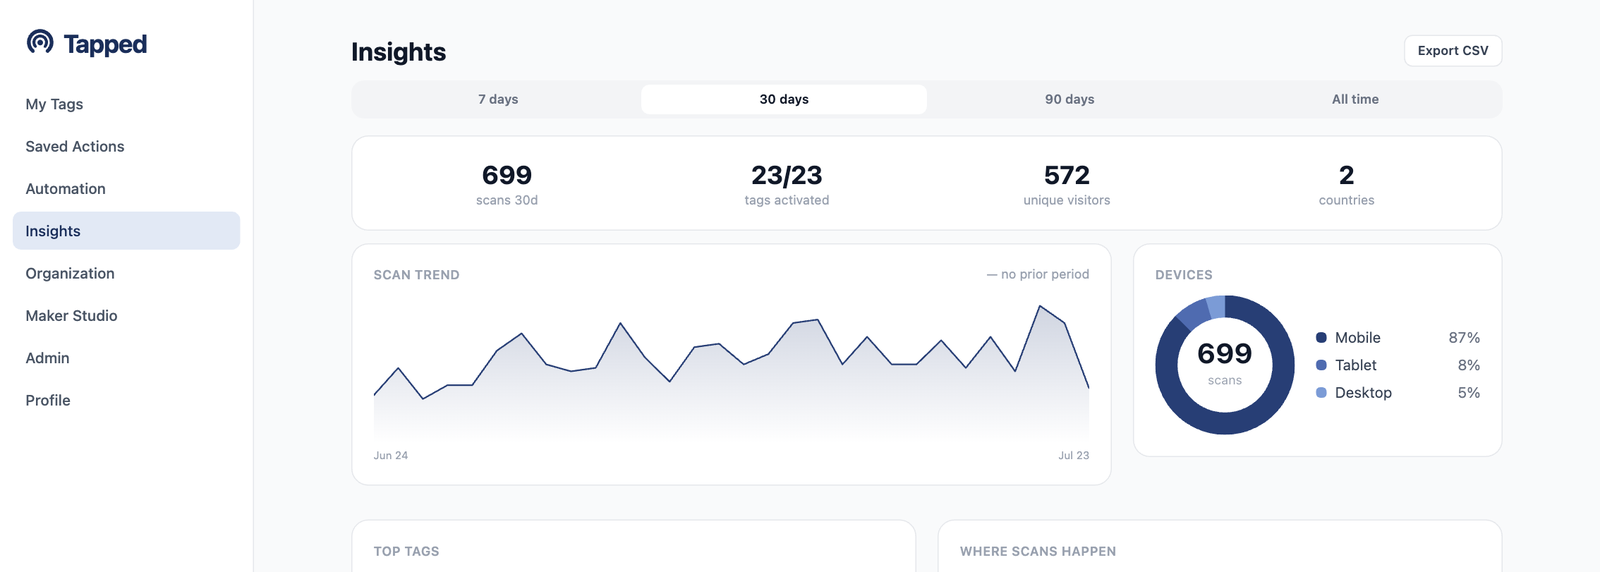
The Insights overview: headline stats, the scan trend, and the device split — all on one screen.
Not just a scan count. Insights shows direction, audience, and place — so you know what's working and where.
Every scan trend is compared against the previous period, so "up" and "down" mean something — not just a line on a chart.
See how many distinct visitors scanned and how many came back. Reach and loyalty, side by side.
Know your audience's hardware: the device, operating system, and browser split behind every scan.
See which tags and groups drive the most scans over any period. Double down on the winners, investigate the quiet ones.
Start at the country level and drill down to cities. See exactly where your scans come from.
Using menu actions? See which buttons people actually tap, so you can put the important ones up top.
The "When people scan" heatmap maps every day of the week against every hour, and calls out your peak window for you. Pair it with a schedule to serve the right content when traffic is highest.

Export your scan data to CSV and take it into Excel, Google Sheets, or your own reporting pipeline.
Form actions come with a submissions viewer and their own CSV export — responses go straight into your workflow.
More features
Insights starts collecting from your very first scan. Open the dashboard and see for yourself.
Open Dashboard